Inspiring Teams to Take Action with Dashboards
Data-driven decision making is one of the many buzzwords heard often in recent times, with it garnering praises that highlights the potential benefits when correctly utilised. In SP Digital, we can attest to this ever since we embarked on using Data to improve our product delivery teams’ effectiveness. 😉
In a typical agile product delivery team, a myriad of tracking tools are used in products/projects when running builds, managing releases, version control, code quality and test coverage. Each of these tools provide feedback via a proprietary dashboard or a set of customisable metrics. The real challenge has emerged:
How can we aggregate all these information to evaluate the overall landscape of the team’s current state?
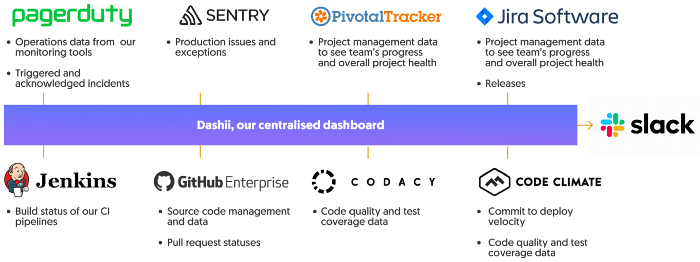
SP Digital Engineering Excellence team’s response was to build Dashii, a centralised dashboard. The primary function of Dashii is to funnel data from different tools and serve as an information radiator through wall displays. This enables us to aggregate all sources of data and translate this into powerful actions.
Setting Up
Our information radiators are basically 55" TVs mounted on mobile stands that are connected to a Raspberry Pi 3 B+. The choice of device should be model agnostic but we made the decision as our office network currently only supports 5GHz wifi signals. We load a customised RaspbianOS that has been hardened and loaded with helper services to manage connectivity, browser and boot cycles.
Dashii is configured to shut down automatically on weekdays at 7 pm and on weekends. Being an EnergyTech company, championing our energy-saving and sustainability ethos is a must 🌏💪🏻.
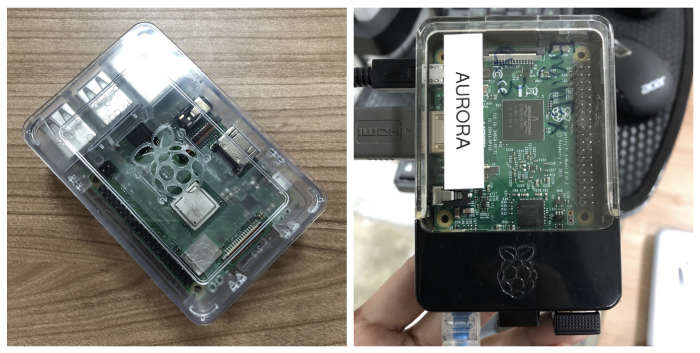
Left: Raspberry Pi 3 Model B+, Right: Raspberry Pi 3 Model B
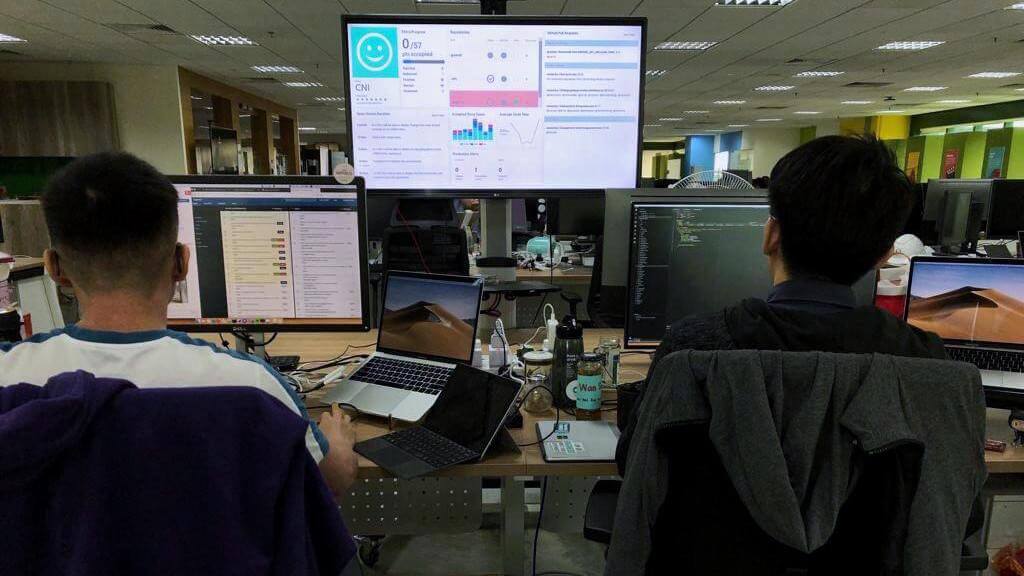
Real-time Wall Displays
This setup is deployed throughout the office. A quick glance around and you will see the unmissable towering TV screens displaying team specific dashboards. Their placement is strategic as well, positioned to capture the most attention so that vital information can be consumed by all 🧐
With that in place, we hope to cultivate and nurture a culture of data transparency.
Information Radiators may exist in other forms:
- Product Performance Metrics ( TV )
- Product Roadmap Diagram ( Wall )
- Team’s Scrum Board ( Whiteboard )
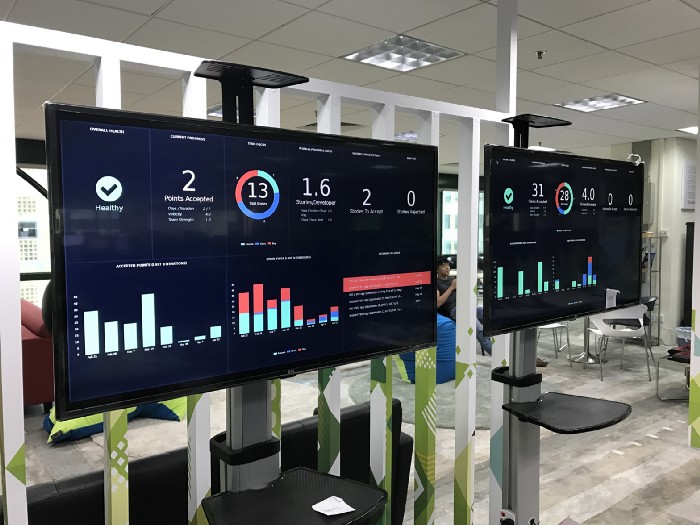
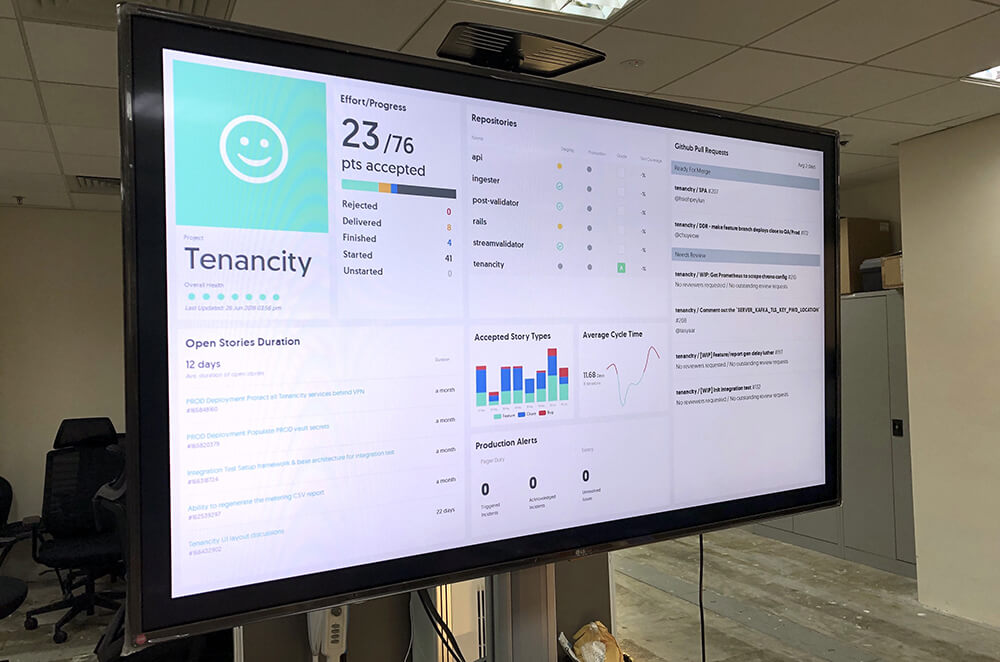
One of the early versions of Dashii.
In an earlier iteration of Dashii, it was used to display the progress of a team. The displayed visualisations we built reflected mostly data from our Pivotal Tracker tool: Story Types, Story States and Story Points. At a glance, team members would be able to gauge their performance. This enabled teams to have a basis for an open and honest conversation with stakeholders.
With the pervasiveness of data transparency, team members naturally became more inquisitive about their performance and additional information obtainable from the dashboard. Hence, requests for features and functionalities to cater for more diversified sources of information were raised. Team members were also keen on how this data is interpreted by stakeholders or management. Which made the team realise:
Building a visual display of information was inadequate. What is the real value we want to provide to our users?
In response, our team decided to conceive our ‘North Star’ that would serve as a compass and navigate the team forward. This was essentially our mission and vision towards Dashii’s development.
Dashii’s Mission
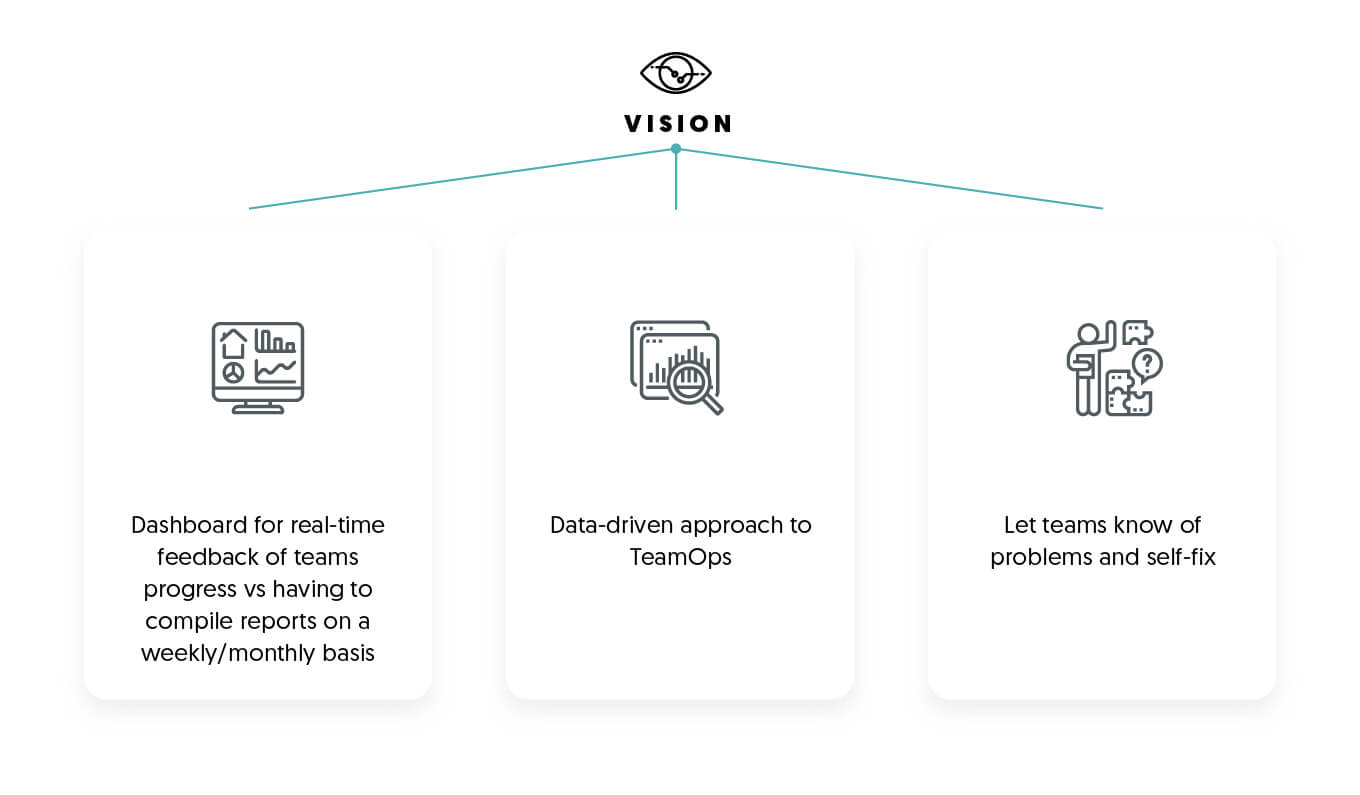
Dashii’s Vision
From this experience, it dawned upon us that improving visibility was easy, but the reality is that our users ( product delivery teams, management ) were unacquainted with utilising this radiated information.
For an information radiator to be effective, the qualifying outcome would be that its radiated information has to be important enough that it inspires users to take action.
Paving the Future with User Research
The team recognised the value of understanding how our users were using Dashii. Enlisting the help of our user researchers, we conducted user interviews with 5 team members and 3 team leads from different product delivery teams. The recordings were then systematically analysed retrospectively which produced the conclusion:
Dashii’s dashboard data was not actionable enough.
Making use of the information gathered from our users, we formulated ideas to improve the dashboard and experimented with small-scale enhancements that we rolled-out fortnightly.
What you choose to measure will have an enormous influence on the behaviour of your team (this is known as the Hawthorne effect)
— Jez Humble and David Farley in Continuous Delivery
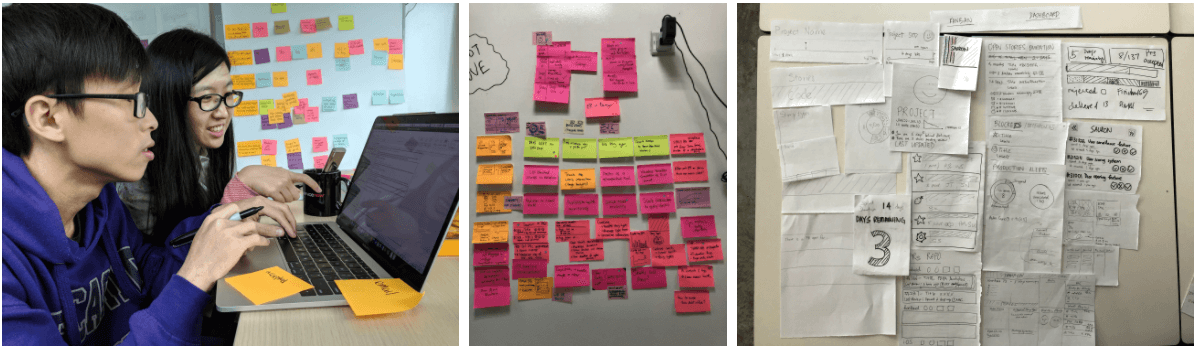
Left: Kang Sheng (developer) with Krystal (user researcher) analysing the research findings.
The current version of Dashii placed intentionally in front of the team.
We switched our approach up by focusing on driving decisions. Dashii would display stories that were pending approval, PRs ready to be merged and builds that were failing, etc. It was an experiment targetted at deliberately changing the behaviours of team members.
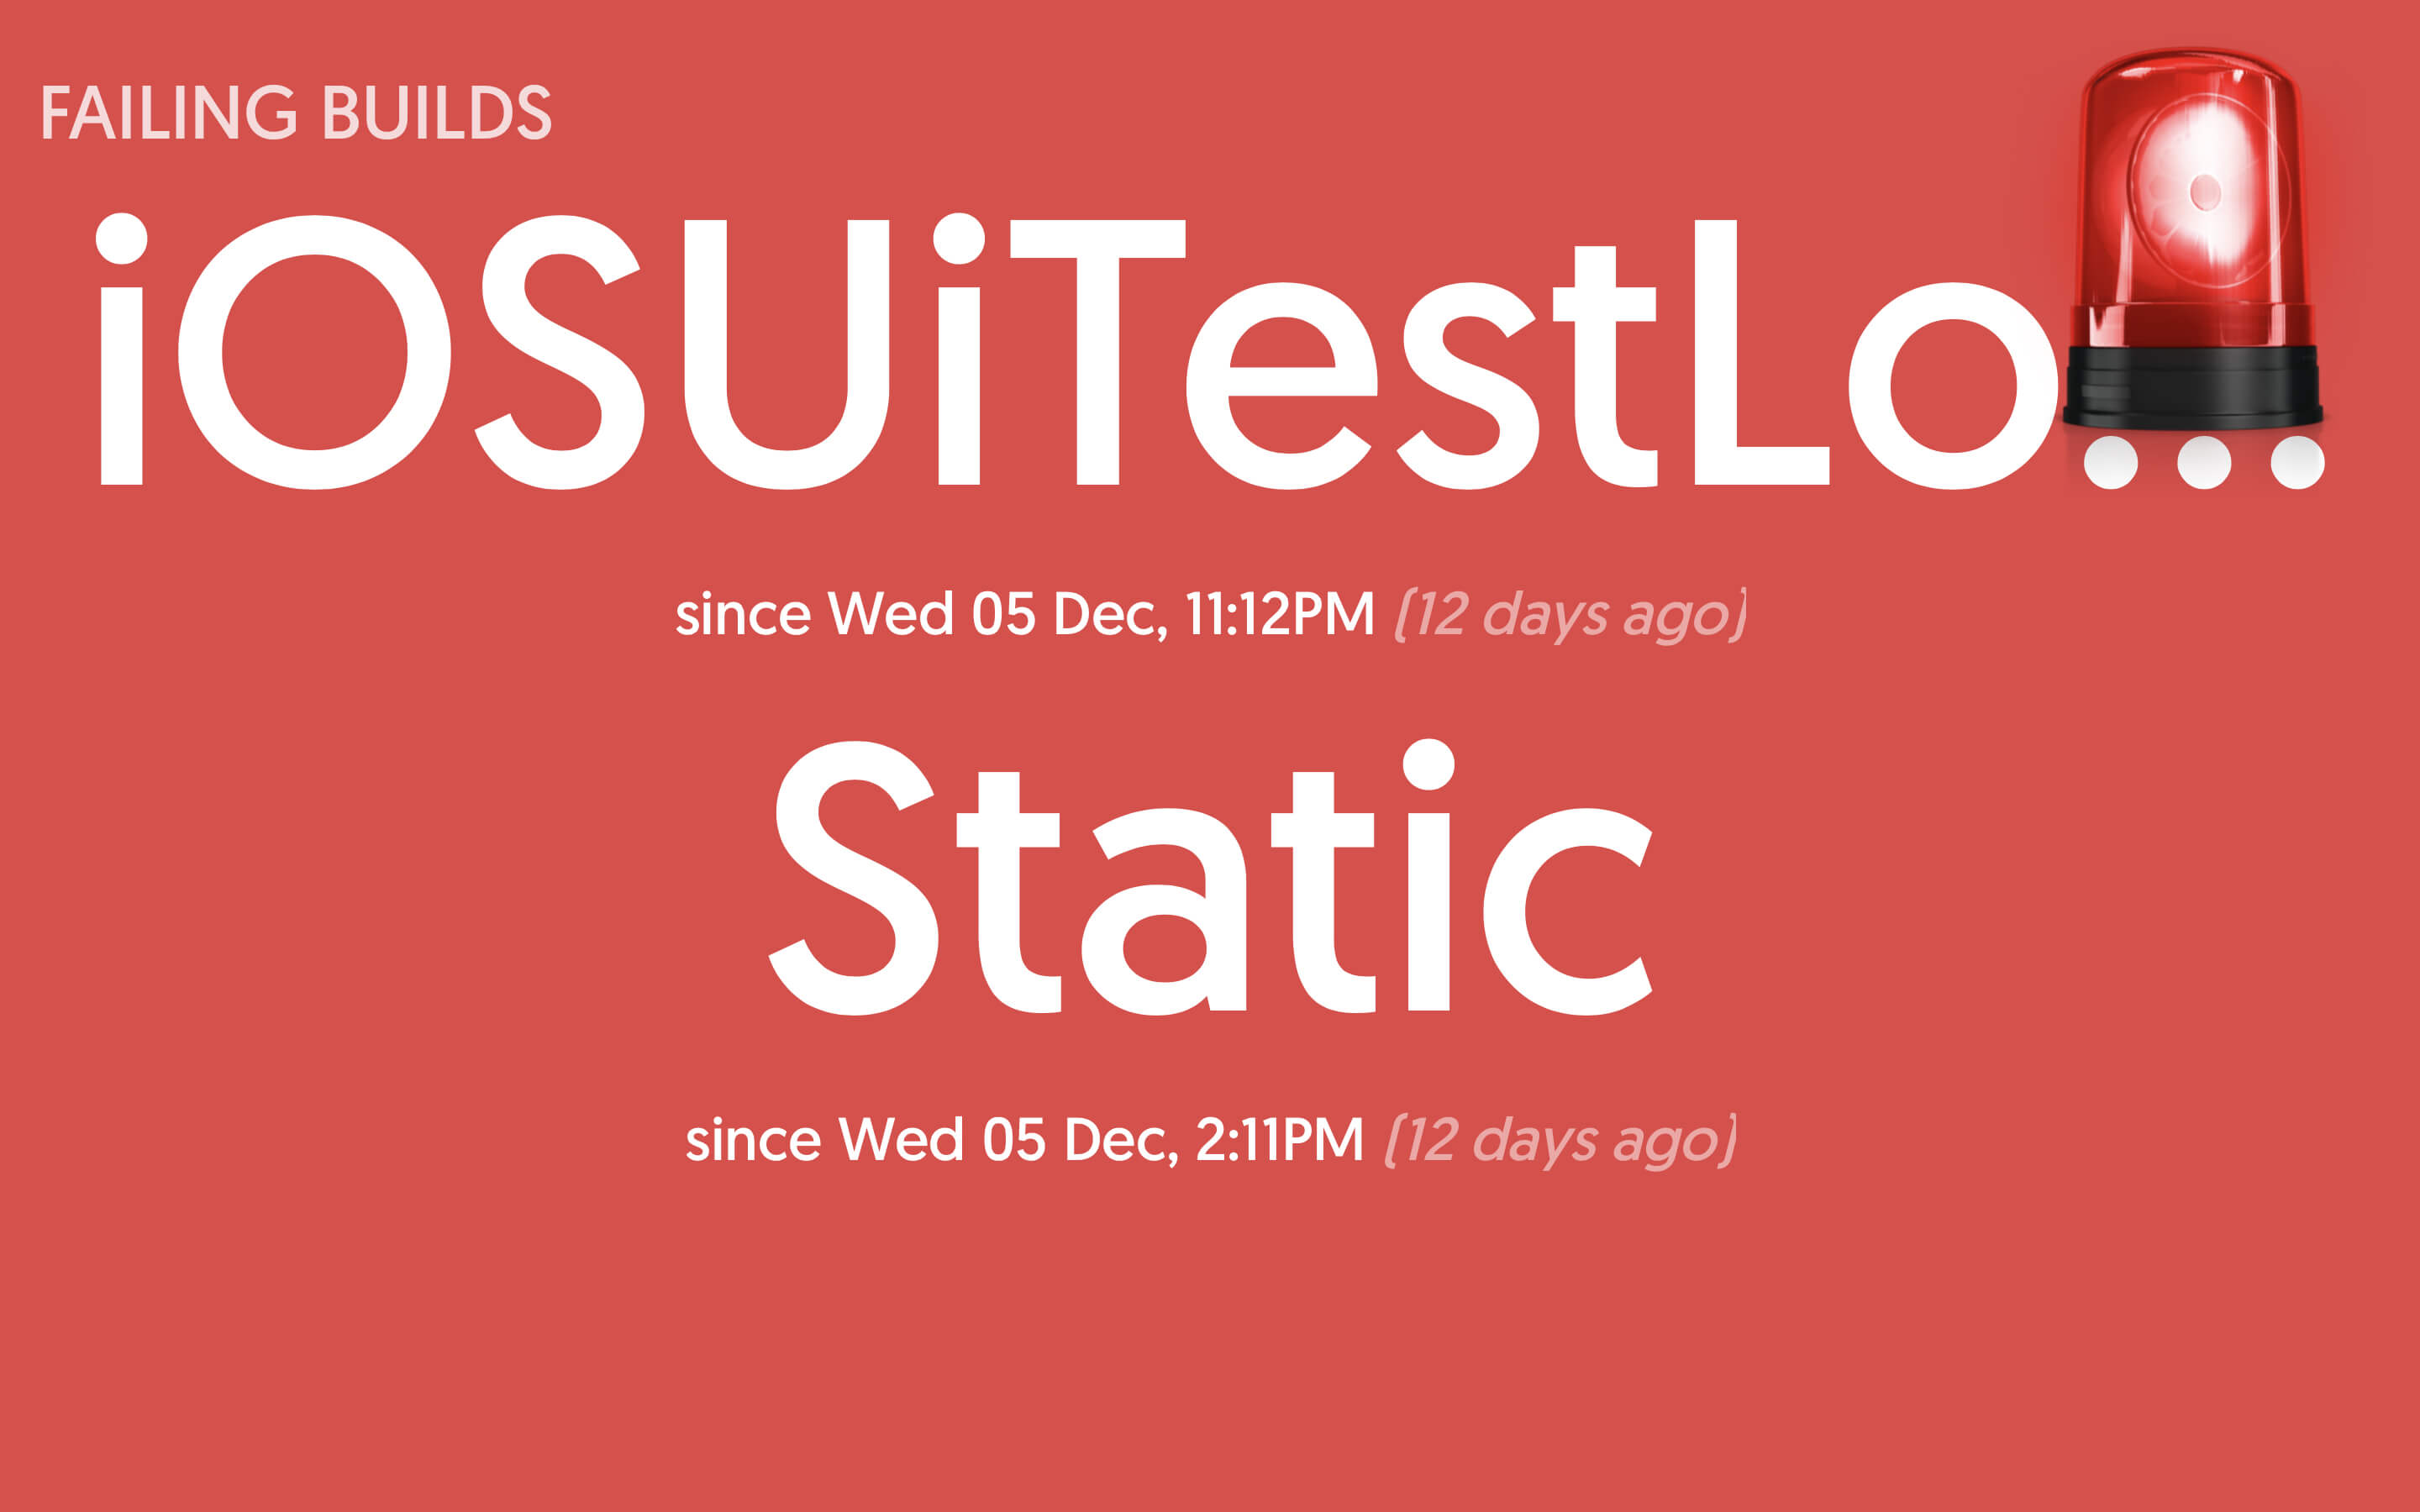
These Jenkins jobs have been failing since 12 days ago! 😱
At present, the team is in progress of implementing supplementary functionalities that include sending summarised reports via Slack and highlighting operational alerts from Pager Duty and Sentry to the entire team.
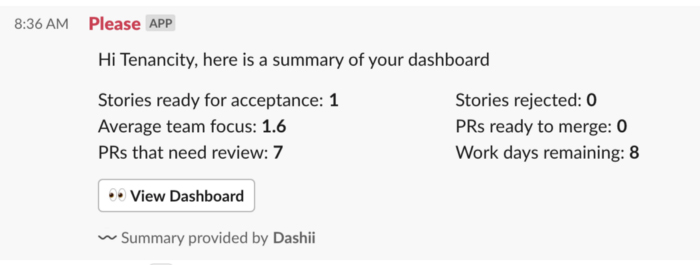
An alert sent to the Slack channel via our Slack bot
Dashii-ing Ahead
The information available for consumption is endless! Without information radiators, we face a reality where heaps of information are left in the shadows and forgotten. Conversely, irradiating too much details might turn into white noise. How do we strike a balance?
This tussle was the most apparent when we tackled the challenge of coping with a growing target audience. Originally, the intended end-users were the product teams but that has expanded to include non-technical stakeholders.
This additional group might not understand the build team’s throughput, how company events and product decisions would impact build progress. Therefore, our goal evolved from just objectively quantifying metrics to also including harnessing this information to allow great conversations to happen.
In time, we believe our dashboards will have the power to assist with planning and even making decisions. We want to remain agile by responding based on observations and not just blindly sticking to a plan. This is the power of having visible, vital information ready at our disposal for inspection and interpretation that will allow us to adapt in any circumstances.